Understand What Your DEXA Scan Really Means:
A Simple Guide to Your Body’s Fat, Muscle, and Bone
✅ Discover what’s really happening inside your body with our easy-to-follow guide to Hologic DEXA scans
✅ Get accurate readings of your bone density, muscle mass, and fat — with less than 0.5% error for muscle
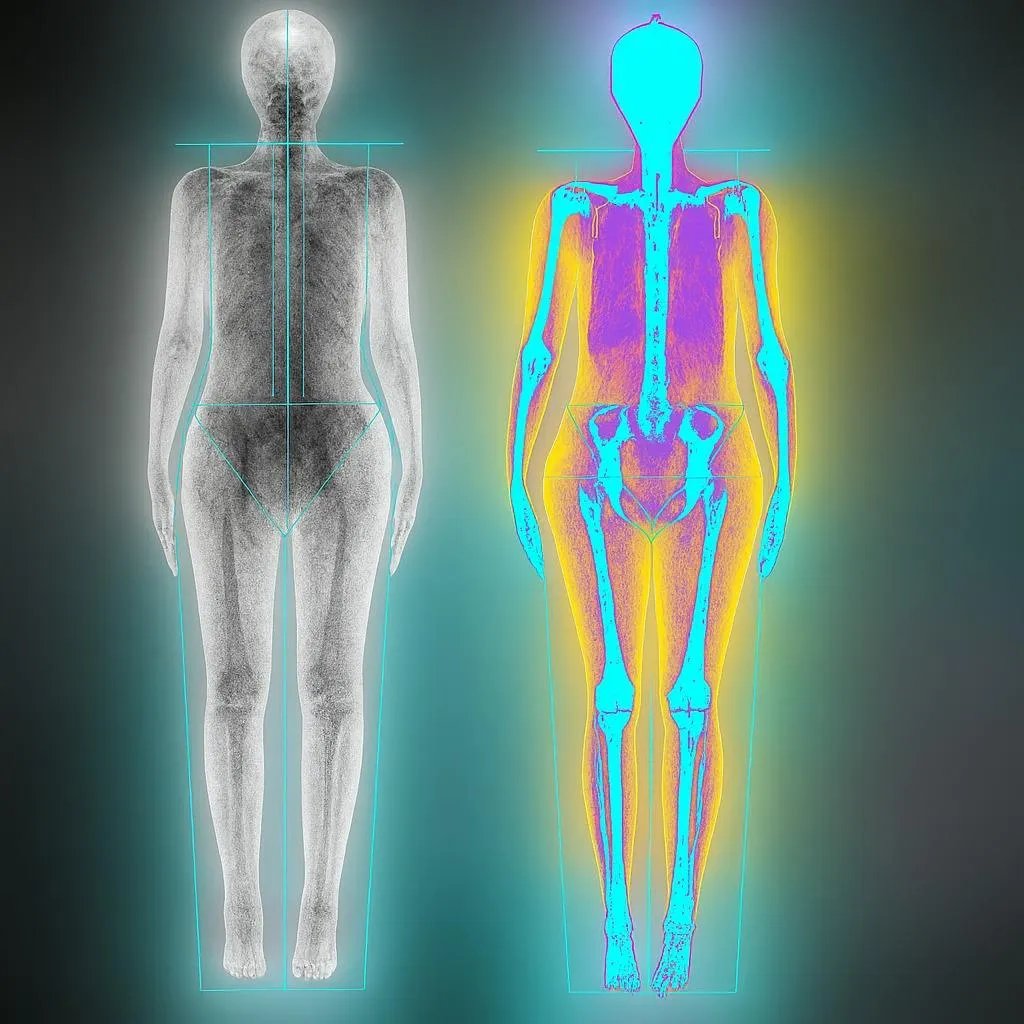
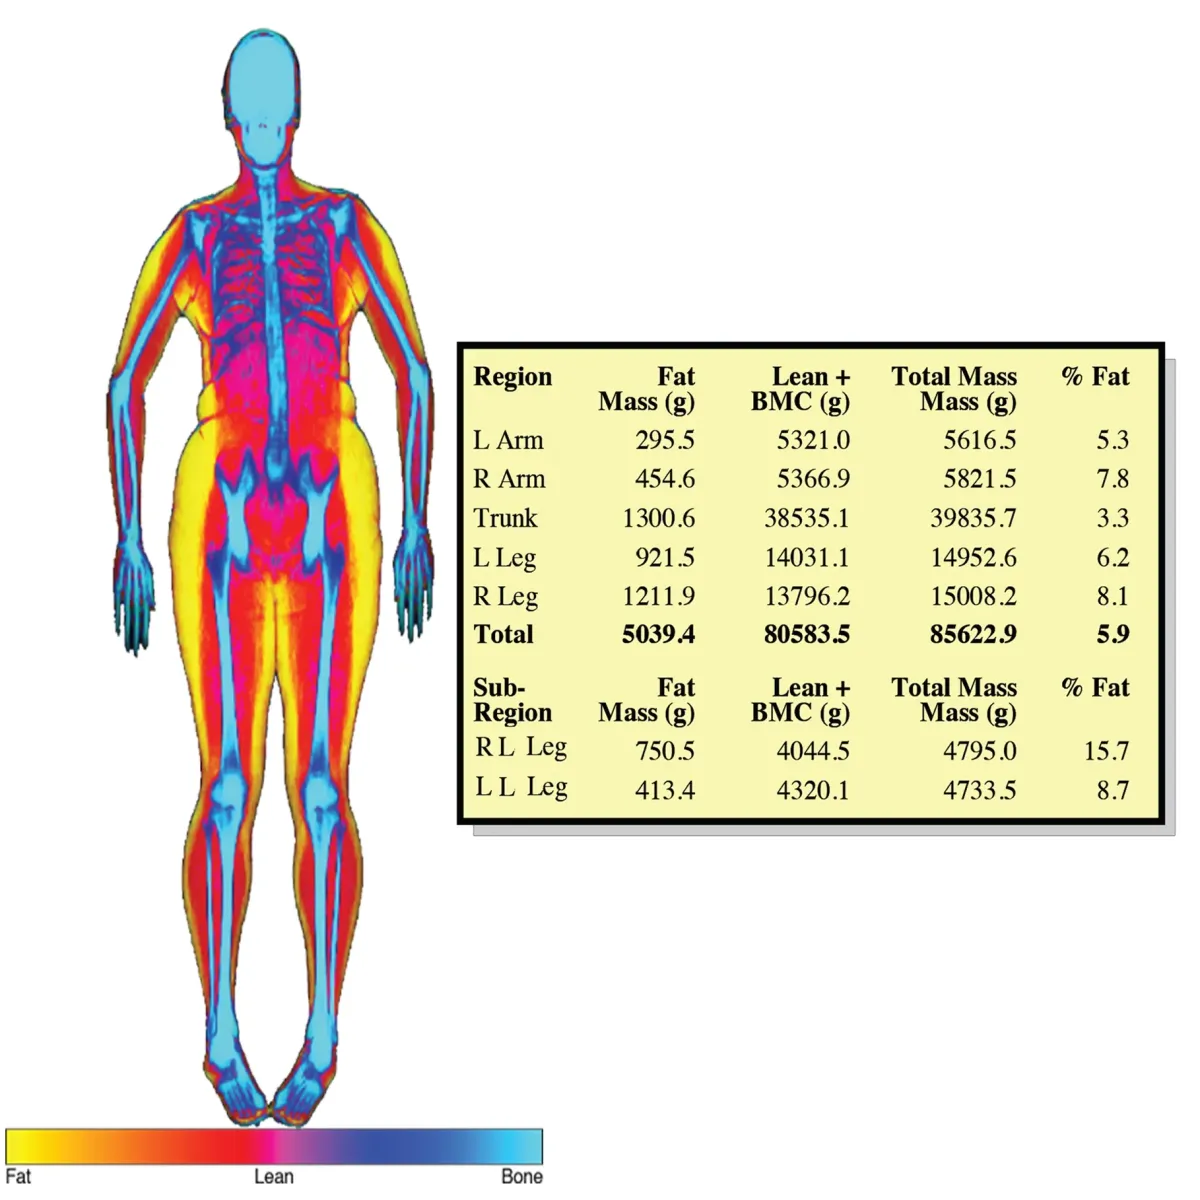
✅ See your results in color — reds and oranges for fat, calming blues for muscle and bone
✅ Break down your body by region — arms, legs, torso, and more
✅ Track changes over time with clear, simple graphs
✅ Compare yourself to national health standards based on age, sex, and race
✅ Spot issues early like obesity, muscle loss, or low bone density
✅ Use your scan results to guide smarter decisions with your doctor
Key Metrics and Interpretation
BODY FAT PERCENTAGE
This measures how much of your total weight is made up of fat.
For men:
✅ Great: 10–20%
⚠️ Intermediate: 20–30%
❗ Needs Improvement: Over 30%
For women:
✅ Great: 15–25%
⚠️ Intermediate: 25–32%
❗ Needs Improvement: Over 32%
💡 Excess body fat increases your risk for heart disease, type 2 diabetes, inflammation, low energy, and poor hormone regulation.
VISCERAL FAT
🔥 Visceral Fat (VAT)
Visceral Adipose Tissue is deep belly fat that surrounds vital organs like the liver and pancreas. This is the most metabolically dangerous type of fat.
For VAT area (measured in cm²):
✅ Great: Less than 100 cm² — indicates low metabolic risk
⚠️ Intermediate: 100–150 cm² — moderate risk, especially when combined with a high BMI or elevated blood pressure
❗ Needs Improvement: Over 150 cm² — high risk for metabolic syndrome, non-alcoholic fatty liver disease (NAFLD), and type 2 diabetes
🚨 Excess VAT is strongly linked to inflammation, cardiovascular disease, hormone imbalance, and insulin resistance.
LEAN MUSCLE MASS
🔹 Total Lean Mass Index (TLM)
This reflects the percentage of your total body weight that is lean tissue, including muscle, organs, and water.
✅ Great: Over 67% — Indicates optimal strength, energy, and metabolic rate
⚠️ Intermediate: Between 33% and 67% — Suggests room for improvement
❗ Low: Below 33% — Associated with increased risk of weakness, frailty, and slower metabolism
💪 Higher lean mass means better blood sugar control, improved balance, greater physical resilience, and reduced injury risk.
APPENDICULAR LEAN MASS INDEX
This measures the amount of muscle in your arms and legs—a critical indicator of strength, mobility, and physical independence.
For men:
✅ Great: Over 8.7 kg/m² — Strong and well-developed limb muscles
⚠️ Intermediate: Between 7.1 and 8.7 kg/m² — Adequate, but could improve
❗ Needs Improvement: Below 7.1 kg/m² — May indicate muscle loss or sarcopenia
For women:
✅ Great: Over 7.3 kg/m² — Optimal for mobility and performance
⚠️ Intermediate: Between 5.5 and 7.3 kg/m² — Moderate, consider strength support
❗ Needs Improvement: Below 5.5 kg/m² — Increased risk of frailty and falls
📉 Low ALMI can lead to loss of mobility, balance issues, and higher risk of injury—especially as you age.
BONE DENSITY
Bone Density (T-Score & Z-Score)
Bone density reflects the strength and mineral content of your bones, which helps assess your risk for fractures or osteoporosis.
T-Score (compared to a healthy 30-year-old):
✅ Normal: A T-score of -1.0 or higher means your bone density is in a healthy range
⚠️ Osteopenia: A T-score between -1.0 and -2.4 suggests mild bone loss and increased risk for future fractures
❗ Osteoporosis: A T-score of -2.5 or lower indicates significant bone loss and a high risk of fractures
Z-Score (compared to others your age and sex):
✅ Great: A Z-score of 0.0 or higher means your bone density is better than average for your age
⚠️ Below Average: A Z-score between -0.1 and -1.0 is slightly below average and should be monitored
❗ Concerning: A Z-score of -1.0 or lower may point to underlying bone health issues
❗❗ Severe: A Z-score of -2.0 or lower may suggest a secondary cause of bone loss (e.g., hormonal or nutritional)
🛡️ Strong bones support mobility, reduce the chance of falls and fractures, and are key to healthy aging.
MAXIMIZE YOUR REPORT'S POTENTIAL!
Your DEXA scan isn’t just a snapshot — it’s a dynamic tool for tracking and optimizing your health over time. Here’s how to get the most out of it:
🔥 Visual Maps & Progress Graphs
See exactly where fat is stored in your arms, legs, and trunk with easy-to-read color-coded heatmaps
Track monthly trends in fat loss, muscle gain, or visceral fat reduction
Quickly compare your current results with your baseline or past scans to see real progress
📈 Compare with National Standards
Your results are matched to NHANES percentiles (national reference data)
50th percentile = average
Target range: Staying between the 25th and 75th percentile supports better health and longevity
💡 Integrated Health Insights
Use DEXA results alongside your Resting Metabolic Rate (RMR) to estimate daily calorie needs
Combine with lab work, fitness testing, and provider feedback to build a personalized health plan
Ideal for goal setting, whether it’s fat loss, muscle gain, or performance optimization
⏱ Track Your Progress with Routine Scans
Re-scan every 3 to 6 months to monitor changes and fine-tune your nutrition, training, and lifestyle strategies
⚠️ Limitations to Keep in Mind
Hydration, recent meals, and clothing or movement artifacts can slightly affect results
DEXA is a powerful tool, but not a standalone diagnosis — it works best when paired with clinical input, labs, and lifestyle data
WHAT SHOULD YOU DO NEXT?
📞 Let’s Talk
Optimize Performance Medicine
📍 290 S. Alma School Rd #15, Chandler, AZ 85224
📞 (480) 660-8817
🌐 www.optimizeyouhealth.com
✉️ [email protected]
🕒 Book a follow-up. Re-scan in 3–6 months to track your transformation.